
One A/C Vent Is Weak While the Others Blow Hard? Build a Repeatable Airflow Map

Map Every Vent
One weak dashboard vent creates an oddly convincing diagnosis: something must be stuck behind that outlet. Sometimes that is true. But the hand is a poor airflow meter, and a cold stream can feel stronger than a warmer stream even when their velocities are similar. Before removing trim, turn the complaint into a pattern that can be repeated.
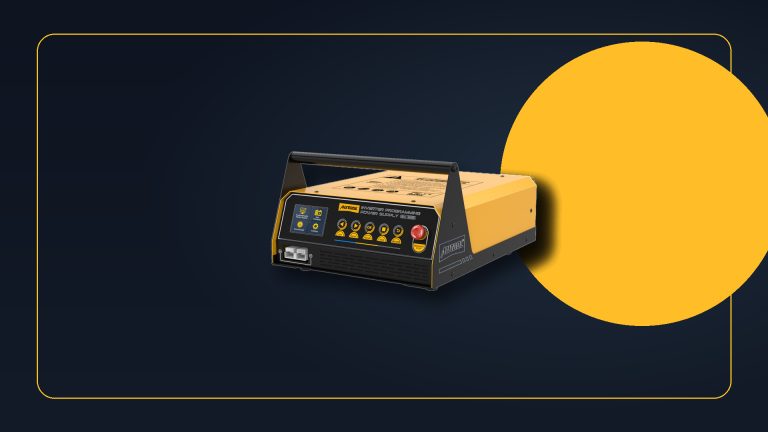
An airflow meter or compact vane anemometer can make that comparison repeatable. The AUTOOL TR401 digital anemometer is one portable route for capturing local air speed and outlet temperature; those readings locate an imbalance but do not name the failed door, duct, filter, evaporator, blower, or circuit.
The useful question is not simply, “Is the left vent weak?” It is, “How does every comparable outlet behave under one locked set of conditions?” A single weak outlet, one weak side, weak face vents with strong floor vents, and low flow everywhere are four different maps. Each sends the inspection toward a different part of the HVAC system.
Quick answer: Lock the HVAC controls, measure every comparable outlet from the same position, repeat a reference vent to detect drift, and let the map separate one weak outlet, a weak branch, a mode problem, or low system-wide airflow.

In this guide
Turn the complaint into a vent grid
Sketch the dashboard as a row of outlets. Label the driver outer, driver center, passenger center, and passenger outer vents. Add rear console outlets if they share the same operating mode and can be tested consistently. For a dual- or tri-zone system, note which temperature zone serves each outlet.
Record what the driver actually notices. Does the difference exist at every blower speed or only on low? Does it change between fresh air and recirculation? Does the weak vent become normal in floor mode, or does one side stay warm while airflow remains strong? A flow complaint and a temperature complaint can feel similar at the grille, so preserve both.
Do a quick visual check before measuring. Make sure every grille is fully open and similarly aimed. Remove loose accessories that block an outlet. Look for a collapsed cabin-filter cover, leaves at the inlet, or a recently disturbed dash panel. Do not use a measurement procedure to overlook an obvious obstruction.
Lock the HVAC controls before measuring
Airflow comparisons mean little if the system changes during the test. Park safely, open all compared vents, set one defined blower step, select one distribution mode, and choose either recirculation or fresh air. Set both temperature zones to the same command unless the complaint specifically involves a zone difference. Keep doors and windows in the same state.
Engine speed matters on some vehicles because charging voltage and compressor behavior change at idle. Automatic climate control may also vary the blower or doors as cabin temperature changes. If possible, use a manual blower command and write down engine state, ambient temperature, and whether the compressor is requested. If the vehicle keeps changing the command, monitor the commanded blower value or repeat the map quickly enough to limit drift.
The sensor position must be repeatable. Center a small vane in each outlet, keep the same distance from the grille, and avoid pressing it against the louvers. Hold it in the same orientation and wait for a stable average. Large rectangular outlets do not have uniform velocity across their face, so use the same center point or take a small, consistent grid at each outlet.
Build the airflow and temperature map
Start at a center vent and record air speed and temperature. Move across the dashboard in one direction, then return to the original center vent and repeat it. If the second center reading has changed substantially, the test conditions drifted; stabilize the system and repeat the map rather than comparing numbers collected under different commands.
An example worksheet can be simple:
| Outlet | Air speed | Temperature | Sound or observation |
|---|---|---|---|
| Driver outer | |||
| Driver center | |||
| Passenger center | |||
| Passenger outer |
Absolute air speed is less important than the relationships within this controlled map. Different grille areas, louver angles, and duct shapes can produce naturally different readings. Compare symmetry where the layout is symmetrical, and compare the same vent before and after a controlled change. A service manual may provide an outlet-temperature or mode-door procedure, but many vehicles do not publish a universal vent-velocity specification.
Read four map shapes
One isolated weak outlet usually moves attention downstream. The grille may be partly closed, foam may have shifted, or the final duct may be disconnected, crushed, or obstructed. A borescope or careful trim inspection may help, but first compare that outlet in every mode in which it is supposed to flow.
A weak side or zone suggests a branch-level issue. A mode or blend door may not reach its commanded position; a linkage, actuator, case seal, or shared branch duct may be involved. If velocity is similar but temperature differs, the evidence points more toward temperature blending or heat exchange than a simple restriction.
Weak face vents with stronger floor or defrost outlets suggest distribution, not total blower output. Listen for air escaping into a mode that was not selected. Watch actuator position data where the vehicle exposes it, and perform only the specified calibration routine. Repeated clicking or a command that changes without a corresponding airflow change is more useful than guessing from the dashboard button alone.
Low flow everywhere moves the diagnosis upstream. Check the cabin filter and its installation, outside-air inlet, recirculation door, evaporator face, blower wheel, motor supply, and control module. Frosting can gradually reduce flow during a long cooling run and then recover after shutdown. That time pattern is different from a permanently blocked duct.
Change one variable at a time
Once the baseline map is saved, change one control and repeat only the readings needed to answer a question. Switch from fresh air to recirculation: did all outlets rise together, or did the weak branch remain weak? Change blower speed: does the ratio between the suspect vent and its neighbor stay similar? Select floor and defrost: does air appear at the intended outlets, and does the original weak area change?
For a dual-zone complaint, command both sides cold, then both sides warm, rather than swinging one side while the other remains fixed. Compare temperatures and velocities separately. A blend-door problem can alter perceived force because warm and cold air have different sensations, while a distribution-door problem changes where the air goes.
Avoid making several interventions between maps. Replacing the filter, recalibrating actuators, moving wiring, and removing a vent at the same time may make the symptom disappear without revealing which action mattered. One-variable retests produce evidence that can survive a comeback.
Follow the map into the correct branch
If the pattern is downstream, inspect the outlet and duct with the least invasive access first. Look for a dislodged coupling, missing seal, foreign object, or crushed flexible section. A smoke source designed for leak tracing can reveal escaping air in an accessible duct, but do not introduce residue or excessive pressure into the HVAC case.
If the pattern follows a mode or zone, use scan data when available. Compare the requested door position with feedback and actual outlet behavior. A scan tool command can prove whether the system attempted to move an actuator; it does not automatically prove the door itself moved or the foam seal remains intact. Mechanical inspection may still be required.
If every outlet is weak, measure blower voltage and ground under load rather than relying on an unloaded connector check. Inspect the wheel for debris or damage. Confirm the filter is the correct part and correctly oriented. If airflow declines over time, compare evaporator temperature, pressure behavior, drainage, and the recovery after the system rests.
Use an airflow meter for the evidence it can prove
An anemometer gives repeatable local velocity when sensor position and system settings are controlled. That is enough to show that one outlet is consistently lower, that a mode change redistributes the flow, or that a repair restores the original relationship. Temperature adds a second dimension and helps separate “less air” from “air that feels less cold.”
It does not directly measure total system volume unless outlet area and the velocity profile are accounted for. It also cannot see behind a door or name the failed component. Treat it as the mapmaker, not the verdict. The next test should address the boundary indicated by the pattern.
This distinction prevents two common mistakes: replacing a blower because one vent is weak, and replacing an actuator because all vents are weak. Both parts can fail, but neither conclusion follows from the first sensation at the grille.
Verify the repaired map
Return every control, window, engine condition, sensor position, and measurement order to the baseline. Repeat the complete grid, including the reference vent at the beginning and end. The repair passes when the original outlier joins the expected pattern, the selected modes route air correctly, outlet temperatures agree with the commands, and the result remains stable across the operating condition that produced the complaint.
Keep the before-and-after map with the repair record. If the driver later reports that the vent is weak only after an hour of cooling or only on automatic mode, you have a known baseline and a new condition to reproduce—not another invitation to guess behind the dashboard.









Comments 0
Questions, fixes, and real-world diagnostic notes from readers.
Be the first to share a diagnostic result or ask a follow-up question.